
INDUSTRY 4.0
SCHOOL OF BUSINESS SUNY NEW PALTZ | Dr. Chih-Yang Tsai
The Time Is Now To Up Your Business Analytics Capacity
IN GOD WE TRUST, ALL OTHERS BRING DATA
– W. Edwards Deming
The COVID-19 pandemic has disrupted the operation of many organizations. It is imperative for organizations to quickly respond to the shifting markets and improve internal processes. Business analytics, with many of its modeling tools, can help detect new demand patterns, identify predictive maintenance needs, or find the product mix to maximize contribution margin. For small and medium sized businesses (SMEs) it can be daunting to deploy an analytics system, especially with the plethora of jargon surrounding it, such as big data, business intelligence, analytics, machine learning, data mining, and artificial intelligence. On one hand, these businesses fear they will miss their chance to hop on the analytics bandwagon, but on the other, they are frightened because they simply do not know where to start. This discussion provides a roadmap for SMEs seeking to build a data-driven decision environment.
DRIVE OUT THE FEAR
Regardless of the jargon, those buzz terms are all about applying quantitative methods on data to extract information or knowledge.
Formally or informally, every organization must have some quantitative analyses already in decision processes, such as budgeting and quality control where decisions are made based on observed patterns.
Besides, there is often no universally agreed upon definitions of those terms. For example, some people consider Business Intelligence as the umbrella term for all other terms, while others view it on a much narrower scope, i.e., the ability to drill-down, roll-up, and chart a multi-dimensional dataset. For the purposes of this discussion, the word “analytics” will be used as a generic term for all quantitative modeling techniques applied on a dataset. When initiating changes in an organization, such as implementing an analytics system, there are often two major concerns from top management: the amount of resources needed and potential employee resistance. However, analytics can be done using tools as simple as an Excel spreadsheet or as cost effective as free open source software. Additionally, resistance is often eased as employees become more familiar with the tools. The following approaches and cases provide insights on how to overcome these two hurdles.
JUST DO IT
For beginners, learning-by-doing is a good way to soften resistance. Through “doing”, organizations nurture a data-driven decision making culture. This culture is built on trust, through engagement, which in turn stems from internal conversations on the results of quantitative analysis. The numerical result serves as a frame for the conversation. However, organizations also need to be aware of the number trap inherent in many key performance indicators (KPIs) for two reasons. First, hardly any indicator can measure the overall performance of an organization.

Obsessing with one goal could improve a specific metric but will likely lead to a sub-optimal solution for the organization as a whole. Therefore it is recommended businesses utilize a balanced scorecard approach. The second reason is, as Goodhart’s Law claims, “When a measure becomes a target, it ceases to be a good measure.” What we often see with a quota-based reward policy is people incentivized to manipulate the system. To develop a data-driven decision making culture, an organization needs to create an open and non-threatening atmosphere when discussing the quantitative result. The discussion is not about assessing the performance of a unit or an individual, but about engaging in a team effort to continuously improve the process for the benefit of the entire organization.
This culture building process is similar to the development of a Total Quality Management culture through W. Edwards Deming’s Plan-Do-Check-Act (PDCA) cycle. So, beginners can start small but keep pushing the envelope. It is also helpful to identify an enthusiast in the early stages to champion the endeavor. TYPES OF ANALYTICS Analytics methods are commonly classified into three categories, descriptive analytics (what has happened), predictive analytics (what will happen), and prescriptive analytics (what to do).
Dashboard and statistical control charts are examples of descriptive analytics. Demand forecasting is an example of predictive analytics where a model identifies the pattern from the historical data and uses it to project future movement. Prescriptive analytics aims at providing a decision for action, for example, “make or buy?” Prescriptive analytics also includes optimization models that find the best decision to achieve a prescribed goal, given some constraints. For example, a product mix decision determines how many of each product to produce in order to maximize total contribution margin while meeting certain requirements and satisfying resource limitations.
A common mistake for starters is asking “what can a model do for us?” instead of “what do we want a model to do for us?”
USEFUL EXCEL TOOLS
Beyond basic data organization, processing, and charting functions, Excel has many powerful functions and add-in’s suitable for business analytics including (1) pivot tables: a multi-dimensional data aggregation tool, similar to the drill-down, roll-up function in Business Intelligence, (2) financial functions: useful for investment decisions, (3) statistical functions: distribution functions good for running simulation studies, (3) the Analysis ToolPak add-in: which includes statistical tools for descriptive analytics and regression functions for predictive analytics, and (4) the Solver add-in: an optimization problem solver for prescriptive analytics.

CASE 1: AN INCREMENTAL APPROACH
A company operates a fleet of sixty small vans to replenish its vending machine merchandise located across several cities. The company currently leases most of its vehicles. Because the leasing company covers all recurring and incidental expenses, managers prefer this risk-free option with a predictable cash outflow. However, relatively low interest rates have prompted the company to consider the buy option and in fact it even purchased several vehicles in recent years. As there has never been a formal evaluation of the two options, the company now wishes to use an analytical approach to drive its decision-making process. In its first effort, the company estimated the average cash inflows and outflows for the two options by vehicle ages and used the estimates to calculate the net present value (NPV) of each option under a range of capital cost rates. An Excel spreadsheet organizes the expected cash flows and calculates the NPVs using the built-in NPV function (Figures 1 & 2).
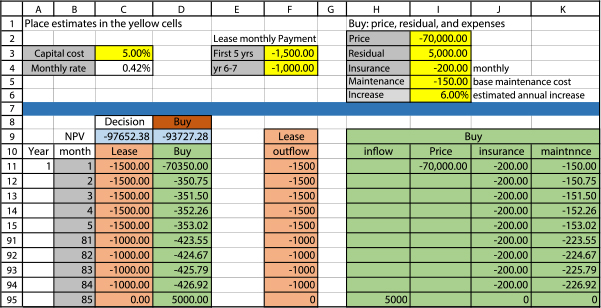
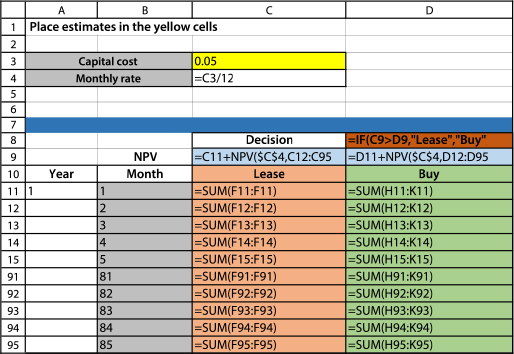
The initial model indicates the buy option is a better choice within most of the range of capital costs. During a discussion of the findings, the financial manager raised an issue that the average expense approach did not consider the risk of unexpected surges of vehicle maintenance cost, which may strain the company’s cash balance. Thus, in stage two, the average maintenance cost estimate was replaced by another estimate obtained from a forecasting model on the age of vehicles, which incorporated a risk factor measured by the standard deviation of the expected maintenance cost. The updated model demonstrated that when the size of owned vehicles increases, the overall risk is reduced. Hence, the buy option is still a better choice under an acceptable risk level. In the next stage, the company plans to build a fleet level decision model that minimizes total fleet cost by finding the best mix of owned and leased vehicles, subject to a cash outflow constraint and a risk tolerance constraint. This incremental approach not only advanced the company’s analytics capability, but also motivated employee buy-in through engagement. A small project such as this provides an excellent starting point due to its clear objective and limited scope.
ASK THE RIGHT QUESTION
A common mistake for starters is asking “what can a model do for us?” instead of “what do we want a model to do for us?” A model is useful only when it solves our problem. So it is important to focus first on asking the right business question, and not worrying about whether there is a model to address the question or not. Chances are, there is something for every question at least to a certain degree. Given the uncertainty involved in a decision environment, anything that sheds some insight on the issue is better than a wild guess. Furthermore, an established PDCA process with employee participation should have a self-correction mechanism. Team members should keep challenging the answer so as to refine the questions and the models.
MOVE TO THE NEXT LEVEL
Initially, companies want to avoid over investing in software, hardware, or personnel, because they might be underutilized during the learning period. Once a company passes the introductory stage and has built up some momentum, it is time to increase the investment and accelerate the pace of development. Although Excel is a good tool to begin with, it is hard to maintain when building more sophisticated models. There are several next level options to expand an organization’s analytics arsenal. Companies wishing to minimize coding need can opt for Excel add-in packages such as Palisade’s DecisionTools Suite or cloud-based services such as Microsoft Azure, which offers drag-and-drop modeling tools. Most vendors offer trial accounts for potential customers to try out. If the company has analytics specialists, open source software like Python and R are free and powerful. Since both programming languages are popular in college curricula, there is no shortage of programmers familiar with these tools. If the company has no designated analytics/IT personnel yet, it should seek to hire or assign one person with analytics and database skills to take charge of further development.
“How can analytics enhance my company’s competitive advantage or be a competitive advantage itself?”
Because analytics relies on data, this is also the time to start working on a data strategy. The first step is to consolidate all separate data sources. The data does not need to reside on one machine, but it needs to be integrated under one framework for data integrity and security. This ensures all analyses are based on clean, consistent, and up-to-date data.
CASE 2: UP TO THE NEXT LEVEL
A company developed a spreadsheet model to allocate its annual marketing budget across products and marketing channels in order to maximize its ROI. Overtime, the spreadsheet has incorporated more and more factors which turned into chained Excel formulas spreading across 20 worksheets. The model allowed managers to adjust the budget allocations and automatically update the resulting ROI through the formulas. As this continued to grow, the company realized the spreadsheet approach had become too cumbersome to maintain. It hired a consultant to rebuild the model in R with a frontend user interface (UI) and an optimization module. The new system simplified the interface allowing users to easily adjust and experiment with different assignments through scroll bars and improved the ROI by 15 to 20 percent on average based on an initial assignment by the managers.

CONCLUSION
Companies routinely collect transactional and process data.
Manufacturers in particular, have a great amount of process data generated from their machines and quality control measures. This data is a great starting point for analytics projects because process data tends to have less noise compared to market data. For example, analytics models have been used to analyze a machine’s vital signs for preemptive maintenance. With more IoT devices adding to the equation, manufacturers without a data strategy may be overwhelmed by too much data, while also being frustrated by the lack of analyticsbased insights.
Creating a data-driven decision making culture is not something that can be achieved overnight by acquiring software, hardware, or specialists. SMEs can overcome the two hurdles by following the roadmap discussed. Once you have established that culture, you are equipped to address the big question, “How can analytics enhance my company’s competitive advantage or be a competitive advantage itself?”

Dr. Chih-Yang Tsai has a Ph.D in Operations Research and is a professor of Operations and Decision Sciences in the School of Business at SUNY New Paltz since 1993.